

SC1000 Comm for Windows®
The SC1000 Comm for Windows® application software is especially designed to make blood pressure measurements on rodents easy and efficient. All system functions are easily accessible through the standard Windows® point and click format. Initialization parameters can be customized and saved under a "Header" menu so that experiments can be easily repeated.
Saving Data
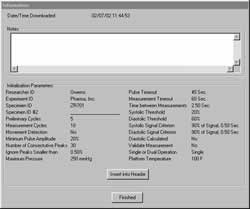
All experiment data, including the signal waveform, is saved under the experiment ID. When an experiment is retrieved for viewing the results and waveforms, the initialization parameters can be also be viewed and notes can be added to the file and saved. The data is also stamped with the date and time that the experiment was conducted.
Viewing Waveforms
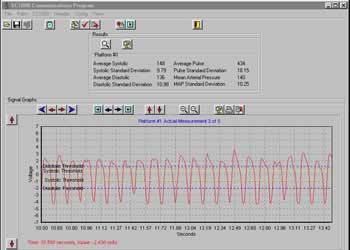
While obtaining measurements, the signal waveform is displayed in real-time. The data is scrolled on the display screen rather than repeatedly redrawn as is standard with other systems.
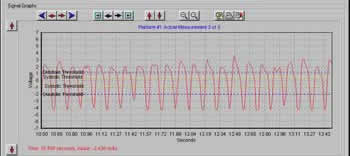
When the waveform data is viewed after saving, the amplitude and time axis can be scaled for an up close view of any portion of the waveform. In addition, the waveform graph can be copied and pasted into common software programs such as Word for Windows®, PowerPoint® or many others.
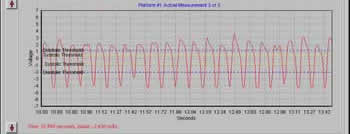
This feature allows a researcher to produce efficient and professional looking reports. The image above is a screen capture showing the computer display as seen when using the program. The image to the left has been copied and pasted into this document using the "copy graph" feature of the software. The graph may also be printed by selecting the print function on the waveform display.
Viewing Results
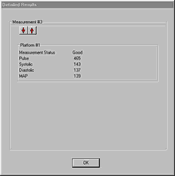

Experiment results are displayed in a results table directly above the waveform graphical display on the computer screen. The detailed results for a measurement set can be viewed by selecting the "Detailed Results" symbol on the results table. When viewing the detailed results, data for each measurement is displayed individually. Arrow keys on the display allow viewing of each successive measurement.
Exporting Results
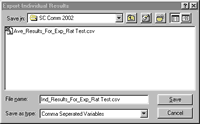
Exporting results to a common spread sheet is as easy as selecting "Export Results" from the main screen file menu. When the "Export Average Results" window appears, the file name block contains the name of the most recent experiment. The experiment name can be changed by opening another folder and selecting the desired file or by retyping the file name. By clicking the "Save" button, the average results are saved in a comma separated value format that can be opened in any common spreadsheet program. After saving the average results, the user is prompted to save the individual results to complete the process.


